Thursday, May 22, 2014

Quiz >> Art

Sometimes it takes a long time to write a quiz become it starts looking more like a work of art (in my mind) than a quick piece of formative assessment.  I'm guessing my students will not enjoy writing this quiz as much as I had fun writing it.


Wednesday, May 21, 2014

Learning Targets

Usefulness of PowerPoint (for not presenting)

Lately I've been using PowerPoint in ways for which it was not originally designed.  In a simple form, I've appreciated using for animations and mapmaking.

There are a number of different animation effects that PowerPoint contains.  And while the make-a-movie feature doesn't work super well, any screen capture programs can do a reasonable job for capturing created animations.  Check out this bear animation:


I've also been using it with some basic mapping skills.  Importing a screen capture from a satellite image then using shapes and lines to build a map on top can result in a pretty great looking map.  Check out part of the process:


Tuesday, May 13, 2014

Common Goal Spinner

OK, maybe this is a little geeky (well, a lot!), but I found an online tool to build a spinner wheel. And when looking at our school district's common goal, isn't it way more fun to take a page from Pat Sajak and Vanna White?


Monday, May 12, 2014

Reflection: Skyscraper Notes

Sometimes modifying a lesson plan is the best way to go.  I was recently inspired by a lesson plan I found on the Crayola site.  While the content was different, it captured the strategies I wanted my students to employ with a nice looking product at the end.  This may have been one of those wherein the product was a bit more impressive online, but my students were up to the task despite its many steps.

We began with a reading wherein we were searching for key information.  Students used a graphic organizer (see images below) and collected key information from each of the paragraph readings on skyscrapers.  This worked very well.
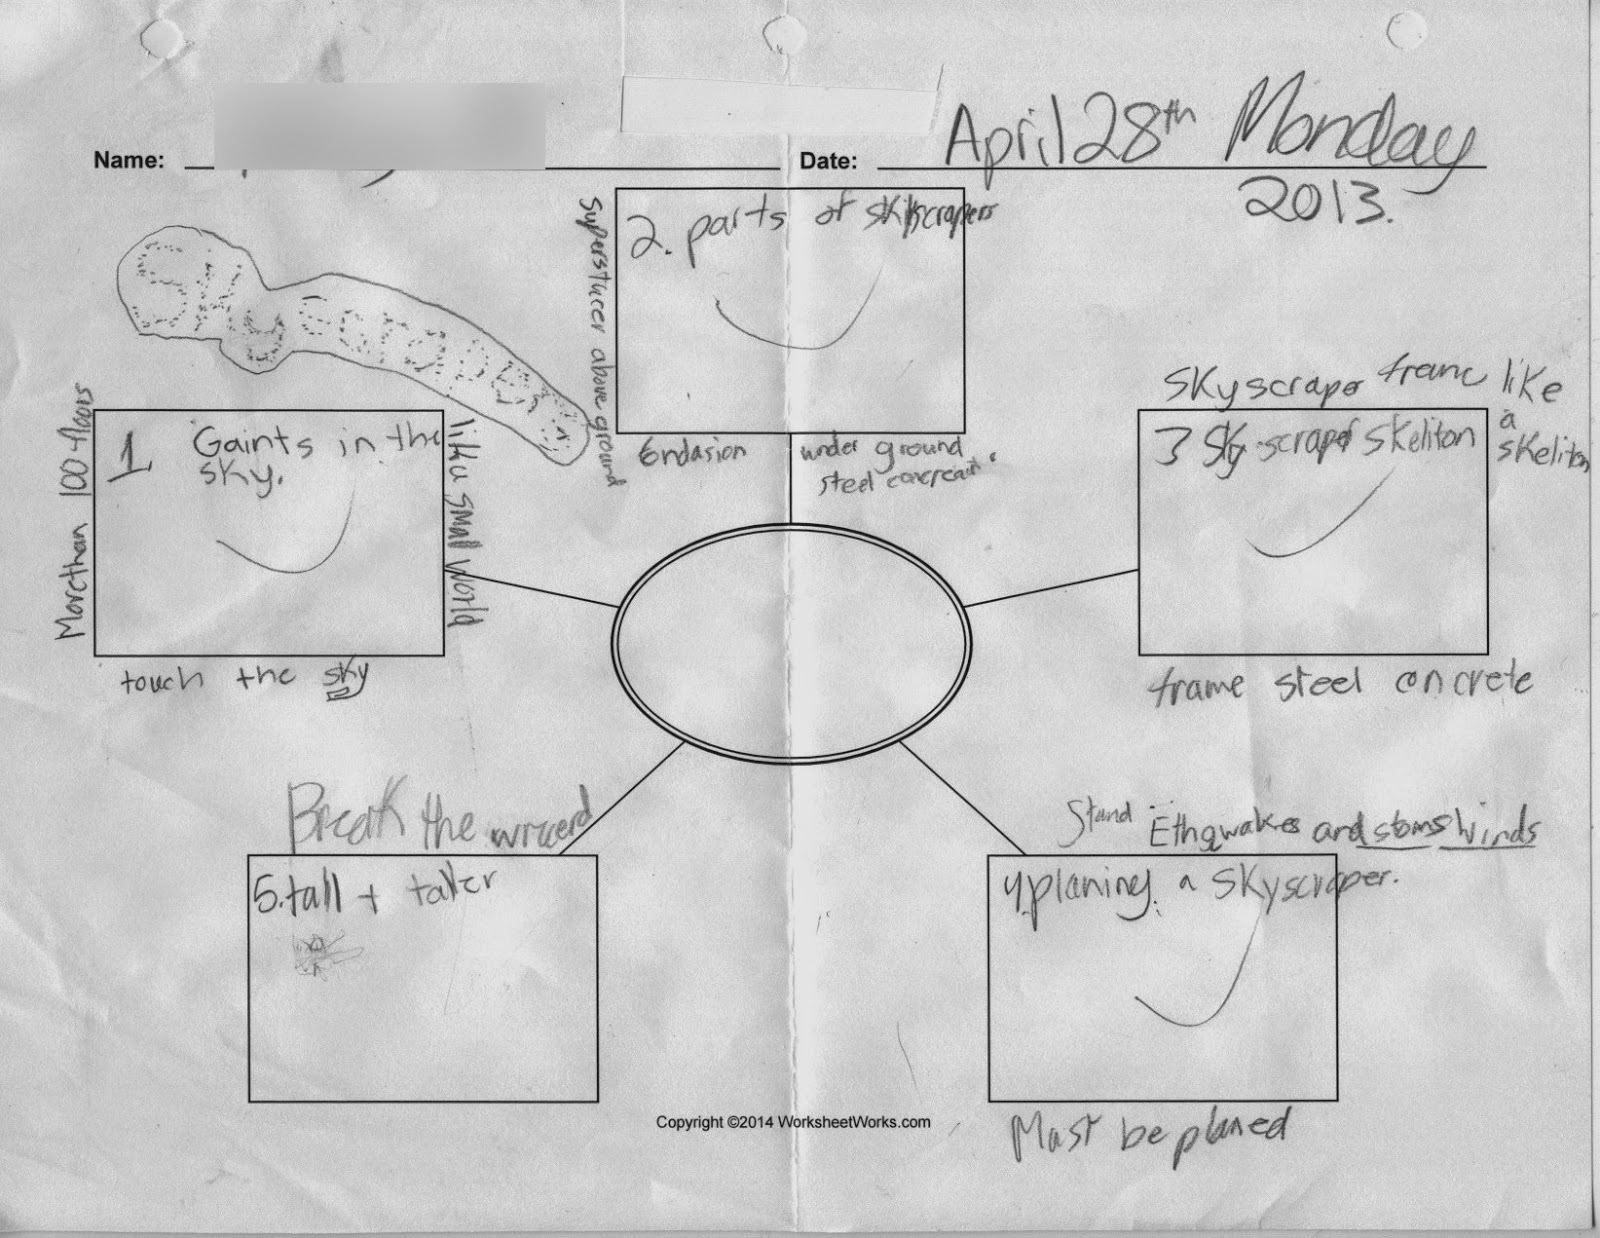
Graphic Organizer A

Graphic Organizer B
From the graphic organizer, the process became a little more graphical.  The key point from the paragraph was written on the skyscraper while the supporting details became the skyscrapers foundations.

Project A

Project B
While the project took on a bit more of an artistic characteristic, I think the finished products reveal (if only slightly) the concept of supporting details through the metaphor of structure foundations.

Reflections for future use:

  • I would definitely stress neatness.  I think I slightly misjudged the artistic capabilities of some students.  I would combat this by having them type their supporting details and print these details off to ensure legibility.
  • While I originally budgeted a couple classes for this project, it ended on becoming a minimum of three.  The multifaceted nature of the project really increased its scope.
  • I think creating background templates would also ensure there would be enough space for the foundational phrases.
  • I would further try to shorten the assignment.  If a student missed a day, it became tricky to bring him/her up to speed.
Due to the length of the assignment, I feel students spent a great deal of time learning about the nature of tall structures.  This is definitely an assignment, however, wherein the process may have been more important than the final product.

Resources:
Process pictures


Thursday, May 8, 2014

Passing a Bill

Sometimes lessons surprise me.  I could spend tons of time on a lesson and have it fail while others times the simplest lesson could have the greatest impact on students.  This is how I felt about this lesson on British Columbia's government: Passing a Bill.

The original lesson was based on a simple, faded photocopied document which challenged students to place events sequentially.  The graininess of the document and the lack of additional information made it difficult; but due to the nature of the high energy class, I improvised and assigned students roles based on the characters portrayed in the document (e.g. some MLAs and members of the public).  We created rough tableaus and I took these images and bolstered the quality of the original photocopy with the newly created, personal images.


For the followup class, I gave the students some more substantial notes then had them take the image tableaus and paste them in order (as per the original exercise) onto a specially prepared note sheet.  Sometimes old ideas work well, but they often require some major enhancements.


Resources:


Self Talk


Tuesday, May 6, 2014

Perimeter Mapping

I have been conducting a problem of the each (POW) each week in my one-day-a-week class and it's realized some evolutionary success over time.  Today I had my students work on a project that had them first estimating then measuring the perimeter of our school.


Part 1: Estimation
I began with my students in small groups (3-4) mapping out the plans of our school.  They then had to estimate what the total perimeter might be.  Guesses ranged from 17m to 470m.  I was a little shocked by the range of responses.  It just shows me that the concept of larger perimeters is somewhat nebulous in the mind of an intermediate student.  The initial sketches weren't bad though they seemed to be a little off with some of the distances.

Part 2: Field Work Estimation
The title for this section isn't the greatest, but it makes sense.  Once I showed them the length of a metre, I sent the groups outside to estimate the school's perimeter.  Students estimated using arm spans and were pretty creative with the ways they measured the distances.  Some worked well in little groups while others just following a single, counting group member.  At the end they came up with a more realistic range of 240m to 580m.  Though this was an improvement the range still was pretty large.

Part 3: Digital Measuring
For the following class, we spent some time with Daft Logic's Distance Calculator to obtain a more precise perimeter measurement.  With the exception of a few outliers, the results were pretty consistent.


Conclusion
To wrap up the lesson and take work in for assessment, I had my students write a short report (the basis for the table above) which included the first and second estimation plus the digital animal with a screen capture (see image above) for evidence.   They were brilliant!


Reflections
  • Assign specific tasks to each group member when measuring the perimeter
  • Allow time to debrief any findings


Thursday, May 1, 2014

Google Docs in French

I delivered a couple routine lessons on using jouer and faire with French vocabulary and I wanted to give my students a chance to practice using it and a way to let my students practice correctly at home.  Through a series of digital flashcards and Google Docs, I think I've come up with a pretty quick and easy way of generating some formative data which will enable me to see where misconceptions may lie and to generate materials to inform future lessons.

I began with presenting the verb conjugations and giving my students a chance to--with pen and paper--practice writing out these examples.  We then spent some time discussing when each verb would be used though the concepts still seemed pretty nebulous.  For homework, I gave them two pieces:

A series of digital flashcards.  The concepts could be reviewed on this site and the notes could also be seen.


Following the flashcards, students followed a link from our class webpage taking them to a short online quiz using Google Docs.


The beauty of the quiz was that the responses immediately fed into an online spreadsheet.


And this I love!  There are some many diagnostic elements to appreciate here.  The simplest piece is I can quickly see is that I can quickly identify the responses of all my students which can then inform my teaching.  From the example above, I can see